|
The hardware used for the project:
- Raspberry Pi 3 model B with Raspberry Pi OS
- Official Raspberry Pi 7 inch touch screen with 800x480 pixel resolution
- Geiger counter by Gravity, which uses M4011 Geiger tube: https://wiki.dfrobot.com/SKU_SEN0463_Gravity_Geiger_Counter_Module
- three additional male-to-female cables to connect the counter to GPIO
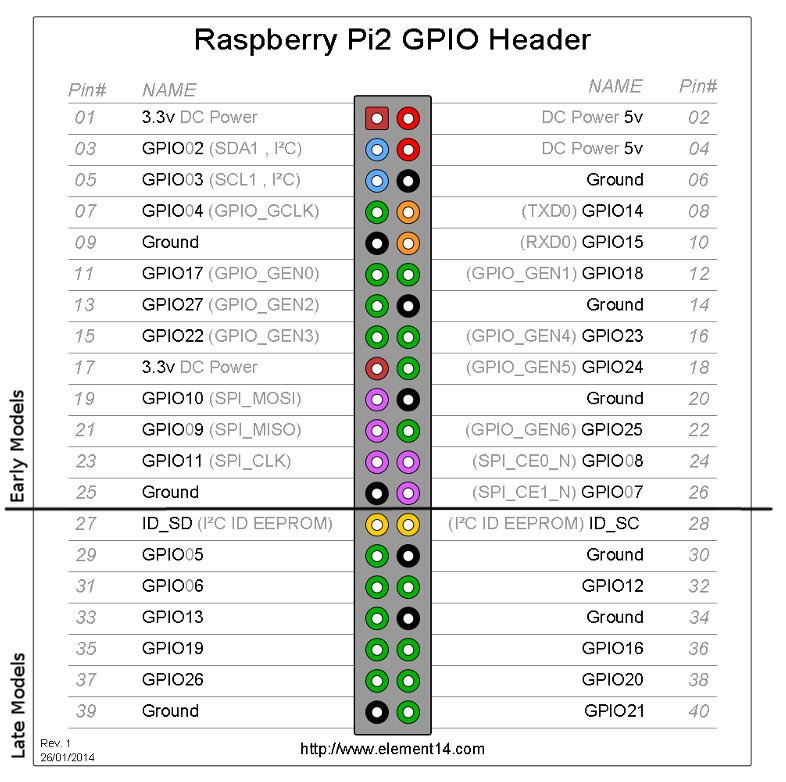
The Geiger Counter is powered by 5V (pin 2) and its ground is connected to pin 6. Pin 16 is used to acquire data. Here is the GPIO pinout:

The registered dose is expressed in counts-per-second. According to documentation the conbversion factor between cps and microsievert per hour is 2.56
(or 153.8 counts per minute = 1 micro-Sievert per hour).
Creating a Qt GUI was probably the longest task. Here is the code:
# 1. Import QApplication and all the required widgets, etc
import sys
from PyQt5.QtWidgets import QApplication, QLabel, QWidget, QPushButton
from PyQt5.QtCore import QTimer, QTime, Qt
from PyQt5.QtGui import QPalette, QColor
from PyQt5.QtGui import QFont
import RPi.GPIO as GPIO
import time
from datetime import datetime

# setup raspberry GIO
GPIO.setmode(GPIO.BCM)
GPIO.setup(23,GPIO.IN) # define readout pin

# 2. Create an instance of QApplication
app = QApplication([])

# 3. Create your application's GUI
window = QWidget()
window.setWindowTitle("Geiger counter GUI")
window.setGeometry(0, 0, 800, 478)

# Force the style to be the same on all OSs:
app.setStyle("Fusion")

# 4. Now use a palette to switch to dark colors:
palette = QPalette()
palette.setColor(QPalette.Window, QColor(53, 53, 53))
palette.setColor(QPalette.WindowText, Qt.white)
palette.setColor(QPalette.Base, QColor(25, 25, 25))
palette.setColor(QPalette.AlternateBase, QColor(53, 53, 53))
palette.setColor(QPalette.ToolTipBase, Qt.black)
palette.setColor(QPalette.ToolTipText, Qt.white)
palette.setColor(QPalette.Text, Qt.white)
palette.setColor(QPalette.Button, QColor(53, 53, 53))
palette.setColor(QPalette.ButtonText, Qt.white)
palette.setColor(QPalette.BrightText, Qt.red)
palette.setColor(QPalette.Link, QColor(42, 130, 218))
palette.setColor(QPalette.Highlight, QColor(42, 130, 218))
palette.setColor(QPalette.HighlightedText, Qt.black)
app.setPalette(palette)

# 5. "Geiger" text
helloMsg = QLabel("Geiger", parent=window)
helloMsg.move(40, 15)

# 6. creating font object for the clock
font = QFont('Arial', 120)
# creating a label object
tlabel = QLabel("    hour      ", parent=window) # need initial string here
# setting center alignment to the label
tlabel.move(178,12)
# setting font to the label
tlabel.setFont(font)


# 7. creating font object for counts-per-second label
fontcps = QFont('Arial', 75)
clabel = QLabel("     cps       ",parent=window) # "cps" is initial string
clabel.move(180,200)
clabel.setFont(fontcps)

# 8. method called by timer
def showTime():
    current_time = QTime.currentTime() # getting current time
    # converting QTime object to string, no seconds because of low update rate
    label_time = current_time.toString('hh:mm')
    tlabel.setText(label_time)

# 9. method to write registered data to csv file
def log_cps(cps):
    with open('radlog.csv', 'a') as file:
        file.write(datetime.now().strftime("%Y/%m/%d %H:%M:%S, ")+str(cps)+'\n')

# 10. method to compute averaged count rate (counts per second)
def get_cps():
    cps=0              # initialize output
    ncounts=0          # running number of counts
    cstat=False        # needed to avoid multiple counting of the same pulse
    while True:        # loop
        if GPIO.input(23)==1 and cstat==False:
            ncounts=ncounts+1
            cstat=True
            if ncounts==1:        # registering the first pulse
                time1=datetime.now()
            if ncounts==13:       # registering the last pulse to be averaged
                time2=datetime.now()
                dtime=(time2-time1).total_seconds()
                cps=12.0/dtime # average over 12 counts
                #print(cps)
                log_cps(cps)
                clabel.setText("{:5.3f} cps".format(cps)) # plotting result on screen
                ncounts=0
                break
        # resetting the acquisition after end of the pulse
        elif GPIO.input(23)==0 and cstat==True:
           cstat=False

# 11. creating a timer object for the clock
timer = QTimer()
# adding action to timer
timer.timeout.connect(showTime)
# update the timer every second
timer.start(1000)


# 12. creating a timer object for the counts-per-second
timercps = QTimer()
# adding action to timer
timercps.timeout.connect(get_cps)
# update the timer every second
timercps.start(1000)

# 13. Quit button
qbtn = QPushButton('Quit',parent=window)
qbtn.move(660,410)
qbtn.clicked.connect(QApplication.instance().quit)


# 14. Show application's GUI in full screen
window.showFullScreen()

# 15. Run your application's event loop
sys.exit(app.exec())
|